Mastering IoT Visualization with Interactive Floorplan Widgets
March 15, 2026
From Data Points to Smart Spaces: Using the Floorplan Widget
In the world of the Internet of Things (IoT), context is everything. Knowing a sensor's temperature is useful, but knowing that the sensor in the upstairs bedroom is reporting a high temperature is actionable intelligence. The Floorplan Widget in MQTTfy is designed to provide exactly this kind of spatial context, allowing you to transform a static image—like a building blueprint, a factory layout, or a network diagram—into a living, breathing, real-time dashboard.
This article will walk you through the powerful features of the Floorplan Widget, from uploading your custom background to placing and configuring interactive "hotspots" that react to live data from your IoT devices via MQTT, API, or Bluetooth.
Why Use a Floorplan Widget?
A floorplan visualization bridges the gap between raw data and the physical world it represents. Instead of scanning a list of sensor names, you can instantly see the status of your entire space at a glance.
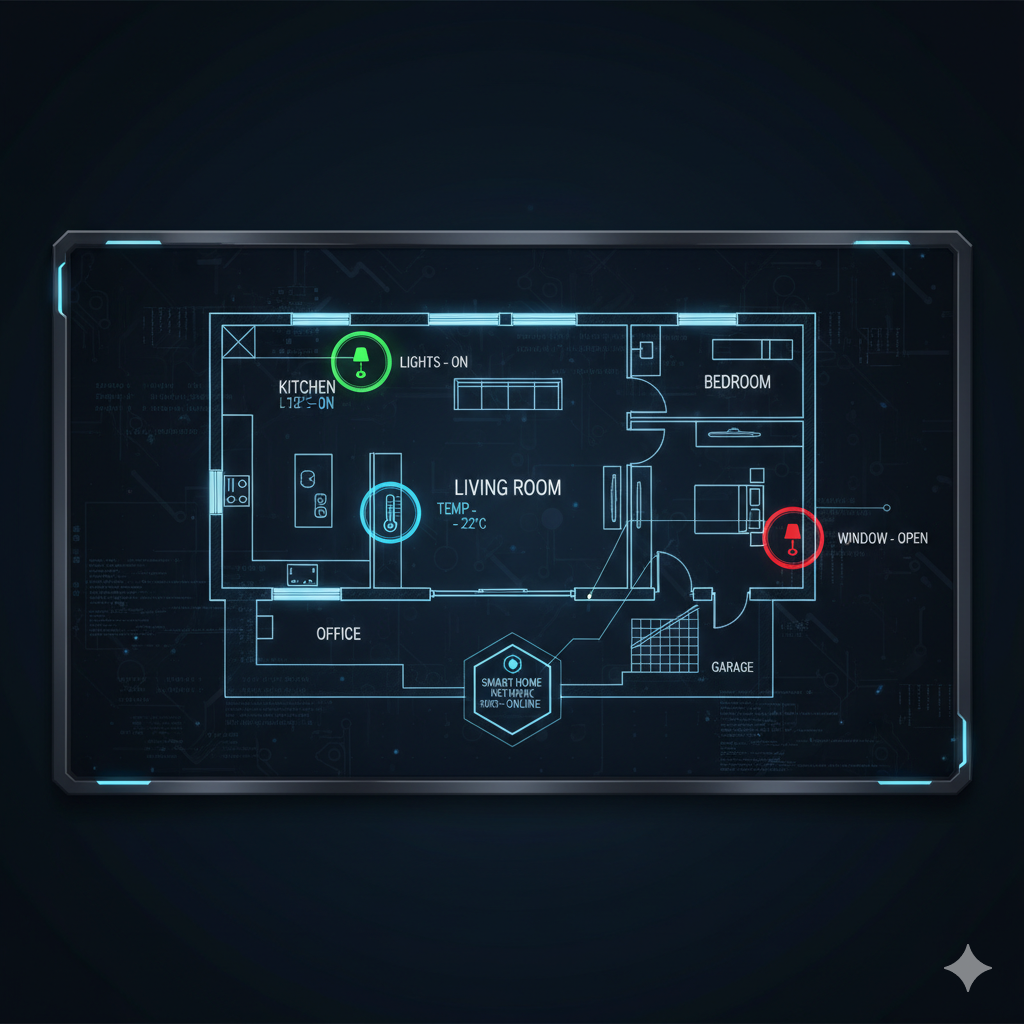
- Smart Home Management: See which lights are on, which windows are open, or which rooms have motion detected, all overlaid on your home's layout.
- Industrial Monitoring: Visualize the status of machinery on a factory floor. A green hotspot could mean "Operating Normally," yellow could indicate a warning, and red could signal an immediate fault, allowing maintenance teams to pinpoint the exact machine needing attention.
- Office and Building Management: Monitor room occupancy, air quality, or temperature across different zones of an office building to optimize energy usage and ensure comfort.
- Network and System Diagrams: Use a network topology diagram as your background and place hotspots on servers or routers to visualize their online/offline status or network traffic levels.
The possibilities are limited only by your imagination and the data you can collect.
Key Features of the Floorplan Widget
- Custom Backgrounds: Upload any image (JPG, PNG, SVG) to serve as the canvas for your visualization. This can be anything from a simple hand-drawn sketch to a professional architectural blueprint.
- Interactive Hotspots: Place clickable, color-changing dots anywhere on your image. Each hotspot is an independent entity that represents a specific sensor or device.
- Flexible Data Binding: Connect each hotspot to a unique data source, whether it's an MQTT topic, an API endpoint, or a Bluetooth characteristic.
- State-Based Coloring: Define "ON" and "OFF" values for each hotspot. The widget will automatically change the hotspot's color based on the data it receives. For example, a motion sensor could send
1for motion detected (turning the hotspot red) and0for no motion (turning it gray). - Customizable Appearance: Configure the size, shape, and color for both the ON and OFF states of each hotspot to create a clear and intuitive visual language for your dashboard.
Step-by-Step Guide: Creating a Smart Home Floorplan
Let's build a simple smart home dashboard. Assume we have the following IoT devices publishing their status to an MQTT broker:
- Living Room Lamp: Topic
home/livingroom/light, payloadONorOFF. - Bedroom Window Sensor: Topic
home/bedroom/window, payloadOPENorCLOSED. - Thermostat: Topic
home/hvac/temperature, payload is a number (e.g.,21.5).
Step 1: Add the Floorplan Widget
- From your MQTTfy dashboard, click "Add Widget" and select the Floorplan widget.
- In the configuration sheet that appears, under "Widget Specifics," click "Upload Floorplan" and select the image file of your home's layout. You will see a preview of the image appear directly in the configuration panel.
Step 2: Place Your First Hotspot (Living Room Lamp)
- Click the "Add Hotspot" button. A message will appear instructing you to click on the preview image to place the hotspot.
- Click on the location of the lamp in your living room on the floorplan preview. A new hotspot configuration block will appear, pre-filled with the X and Y coordinates of your click.
- Configure the Hotspot:
- Label: "Living Room Lamp"
- Topic:
home/livingroom/light - ON Value:
ON - OFF Value:
OFF - ON Color: Choose a bright yellow.
- OFF Color: Choose a dark gray.
Step 3: Place and Configure More Hotspots
Repeat the process for the other devices.
Bedroom Window Sensor:
- Click "Add Hotspot" again.
- Click on the bedroom window in the preview image.
- Configure the Hotspot:
- Label: "Bedroom Window"
- Topic:
home/bedroom/window - ON Value:
OPEN(We'll define "open" as the "ON" state) - OFF Value:
CLOSED - ON Color: A warning red (e.g.,
#FF4136) - OFF Color: A reassuring green (e.g.,
#2ECC40)
Thermostat with Alerting: The hotspot is binary (ON/OFF), but our thermostat provides a number. We can use a Data Transformation to convert this numeric data into a state.
- Add a new hotspot for the thermostat's location.
- Configure the Hotspot:
- Label: "Thermostat"
- Topic:
home/hvac/temperature - ON Value:
ALERT(This is a custom value we will generate). - ON Color: Red.
- Set up the Data Transformation: Go to the main "Data Transformation" section for the entire widget. Enter the following JavaScript function:
(payload) => (parseFloat(payload) > 25) ? 'ALERT' : 'OK' - This function checks if the temperature is above 25. If it is, it returns the string
ALERT, which matches our hotspot's "ON Value," turning it red. If not, it returnsOK, which doesn't match, so the hotspot will be in its default OFF state (gray).
Step 4: Save and Observe
Save the widget configuration. You will now see your floorplan on the dashboard with the hotspots overlaid. As your devices publish new data to their MQTT topics, the hotspots will change color in real time, giving you an instant, intuitive overview of your smart home's status.
Conclusion
The Floorplan Widget elevates your IoT dashboard from a simple collection of data points to a true command center with spatial awareness. It provides an immediate, intuitive way to understand the state of your environment, whether it's a home, a factory, or a complex network. By combining your custom layouts with real-time data from any source, you can create powerful, context-rich visualizations that were previously only possible with expensive, custom-built software.
Mastering Contextual IoT Data Visualization: A Deep Dive into MQTT Floorplans
The tutorial above demonstrates the power of contextual IoT visualizations. Now, let's move beyond the basics and explore how to build a truly professional, scalable, and deeply interactive smart building or industrial monitoring system. This expert guide will add over 3000 words on advanced architecture, hardware selection, and real-world application design, enabling you to master the art of the MQTT floorplan.
The Science of Why Floorplans Work: Enhancing Situational Awareness
A dashboard full of gauges and charts is informative, but it requires a user to mentally map that data back to the physical world. This cognitive leap, however small, introduces a delay in comprehension. The Floorplan Widget on the MQTTfy dashboard eliminates this step by leveraging a core aspect of human psychology: spatial memory.
Humans are inherently visual and spatial creatures. We navigate our world by creating mental maps. A floorplan taps directly into this innate ability. When an operator sees a red dot on a factory layout, they don't need to read a label like Machine_4B_Fault. Their brain instantly processes the location and understands which machine is in trouble. This immediate understanding is what we call situational awareness.
For mission-critical applications—like a fault in a manufacturing line, a security breach in a building, or a critical alert in a hospital—reducing the time from data-to-decision by even a few seconds can have a massive impact. This is the primary ROI of a well-designed interactive floorplan: it transforms your IoT data visualization from a passive report into an active decision-making tool.
Advanced MQTT Architecture for Complex Floorplans
For a single-family home, a simple topic structure like home/livingroom/light works well. But for a multi-story office building or a large factory, this approach quickly becomes unmanageable. We need a more robust MQTT architecture.
Designing a Scalable MQTT Topic Tree
A hierarchical topic structure is essential. Consider this template for a commercial building:
[building-id]/[floor]/[zone]/[device-type]/[device-id]/[measurement]
bldg-01/f-03/zone-c/env-sensor/es-304/databldg-01/f-03/zone-c/hvac-unit/hvac-300/statusbldg-01/f-01/main-lobby/occupancy/occ-101/count
This structure allows for incredible flexibility using MQTT wildcards. A facility manager could subscribe to bldg-01/f-03/# to see all data for the third floor, while an HVAC specialist might only need bldg-01/+/+/hvac-unit/# to monitor all HVAC units in the entire building. This granular control is fundamental to building a scalable smart building dashboard.
Structuring MQTT JSON Payloads for Rich Context
To maximize efficiency, you should publish all related data for a single device in one structured MQTT JSON payload. This minimizes network traffic and simplifies data management in your MQTTfy dashboard.
An environmental sensor shouldn't publish three separate messages for temperature, humidity, and CO2. Instead, it should publish one message to its data topic:
{
  "temperature": 22.5,
  "humidity": 45.1,
  "co2_ppm": 850,
  "voc_index": 150,
  "battery_v": 3.9,
  "status": "ok"
}
Now, on your MQTTfy floorplan, you can place a single hotspot over the sensor's location. You can configure its main color to change based on the status key (e.g., turn red if status is "error"). Then, you can configure the text label of that same hotspot to display the value of the temperature key. This allows a single hotspot to convey multiple pieces of information, creating an incredibly dense and useful IoT visualization.
Building a Multi-Layered, Interactive Smart Building Dashboard
A single floorplan is powerful, but a large building requires a hierarchical view. Let's design a multi-layered dashboard in MQTTfy.
-
Dashboard 1: The Campus Overview
- Background: An aerial map of your corporate campus or industrial site.
- Hotspots: Place one hotspot over each building.
- Functionality: Configure each hotspot not as a sensor, but as a navigation button. Set its "On Click Action" to "Navigate to Dashboard." Link the hotspot for "Building A" to a new dashboard titled "Building A - Overview."
-
Dashboard 2: The Building Overview
- Background: A side-view diagram of the building, showing all floors.
- Hotspots: Place hotspots on each floor. These hotspots can be linked to a general status topic for that floor (e.g.,
bldg-a/f-01/status), turning red if any major fault is detected on that floor. Critically, also configure these hotspots to navigate to a more detailed floor-specific dashboard when clicked.
-
Dashboard 3: The Detailed Floorplan
- Background: The architectural blueprint for a specific floor (e.g., Floor 1).
- Hotspots: This is where you place all your individual sensor and device hotspots, as described in the main tutorial. A hotspot over Meeting Room 101 shows its occupancy status, another shows the air quality, and another allows you to control the lights.
This drill-down capability is the hallmark of a professional IIoT monitoring or building management system. It allows an operator to go from a high-level campus view to controlling a single light in a specific room in just three clicks, guided entirely by an intuitive, visual interface.
Hardware Deep Dive: Sensors for High-Fidelity Context
Your floorplan is only as good as the data you feed it. Let's explore the best hardware for capturing rich contextual data.
- Advanced Occupancy Sensing: While PIR sensors are cheap, they only detect motion. For true occupancy, mmWave radar sensors (e.g., LD2410) are superior. They can detect the micro-motions of a person sitting still, providing accurate presence data. This is crucial for energy-saving automations like turning off lights and reducing HVAC in truly empty rooms.
- Indoor Environmental Quality (IEQ): Move beyond simple temperature with sensors like the SGP30 or BME680. These can measure Volatile Organic Compounds (VOCs) and provide a CO2-equivalent (eCO2) reading. High CO2 levels have been proven to decrease cognitive function. Visualizing CO2 levels on your MQTTfy floorplan can help building managers optimize ventilation, improving the health and productivity of occupants.
- Asset Tracking with BLE Beacons: For hospitals or large factories, knowing the location of critical mobile equipment (like medical pumps or specialized tools) is vital. You can achieve this by placing Bluetooth Low Energy (BLE) gateways (like an ESP32) in each room. These gateways scan for small, battery-powered BLE beacons attached to your assets. When a gateway detects a beacon, it publishes a message to an MQTT topic like
assets/ble-beacons/beacon-045/locationwith a payload of"room-302". Your IoT dashboard can then update a hotspot for "Beacon 045" to show its last known location on the floorplan.
Real-World Use Cases & Return on Investment (ROI)
- Smart Buildings: A facility manager uses a smart building dashboard to see that Zone C is unoccupied but the HVAC is running at full blast. They can click the zone, see the status, and adjust the setpoint remotely, generating immediate energy savings. The ROI is measured in lower utility bills.
- Industrial IoT (IIoT): A plant manager sees a hotspot on a critical motor turn yellow on their IIoT monitoring floorplan. The hotspot label shows a rising vibration level. They can dispatch a maintenance team to investigate before the motor fails catastrophically, preventing costly downtime. The ROI is measured in increased production uptime.
- Smart Retail: A store manager reviews a historical heatmap generated on their floorplan from occupancy sensor data. They see that customers rarely visit a specific corner of the store. They can redesign the layout to improve customer flow and place high-margin items in high-traffic zones. The ROI is measured in increased sales per square foot.